A world of patterns.

Explore the patterns connecting science, society, and the natural world through interactive visualizations.

Discover phey.app

Complexity made visible.

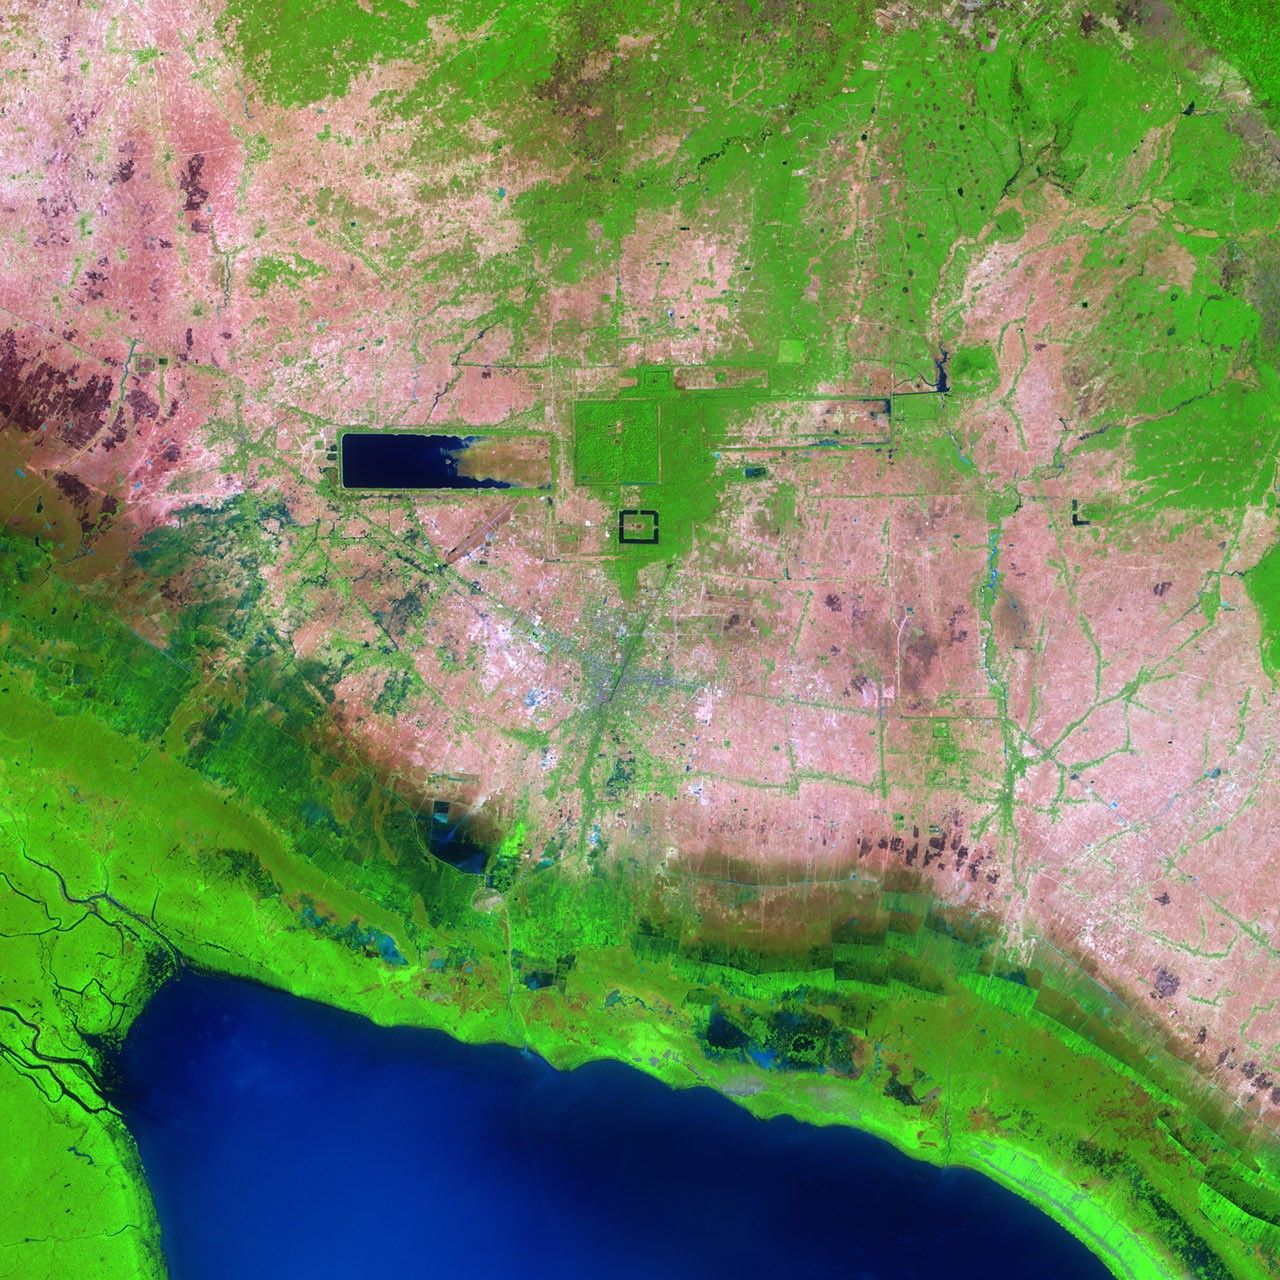
Satellite image of Angkor, Cambodia, showing rectangular reservoirs, temple moats, and surrounding vegetation
Connections, seen from a different perspective. The temples and reservoirs of Angkor, Cambodia. Image: NASA Earth Observatory / Jesse Allen.

phey.app is a space for exploring ideas through data. From the paths of rivers to the geometry of gravity, these projects make complex relationships visible and invite you to look closer.

Interactive exploration
Discover a growing collection of charts, flow maps, and visual experiments across science, mathematics, and society.
Python at the source
Every project begins in a Jupyter notebook. Explore the code and thinking behind the visualizations.
From 2 to 4 dimensions
Move from a simple line to a four-dimensional tesseract. Change your perspective and see familiar ideas in a new way.

Explore the collection

Follow your curiosity.

Different questions. New perspectives.
Each project is an invitation to explore.

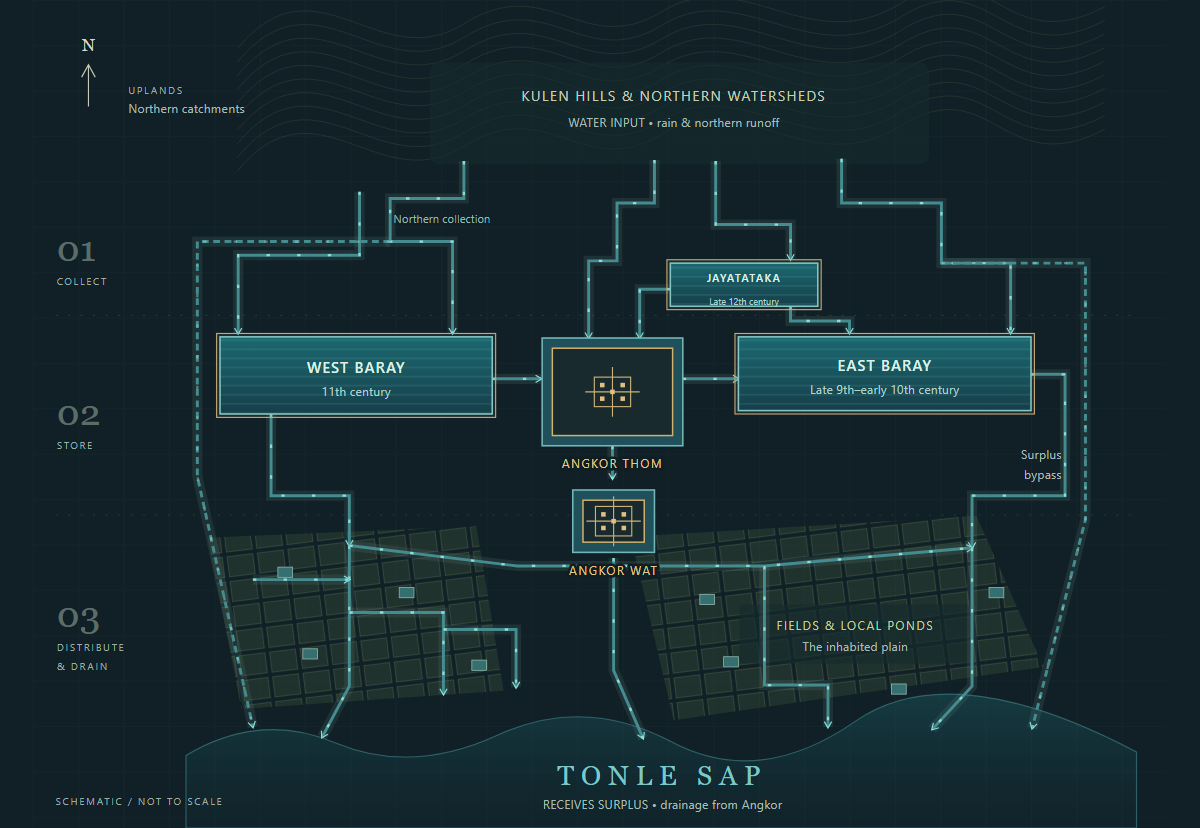
Schematic atlas of Angkor's water network, from northern catchments through reservoirs and fields to Tonle Sap

01 / Archaeology

The hydraulic city.

Follow the water canal system of Angkor—from northern catchments through the Baray reservoirs and the inhabited plains toward Tonle Sap. Explore schematic monsoon and dry-season views, the journey through the network of canals, and the scale of the great barays.

Explore Angkor hydraulic city atlas
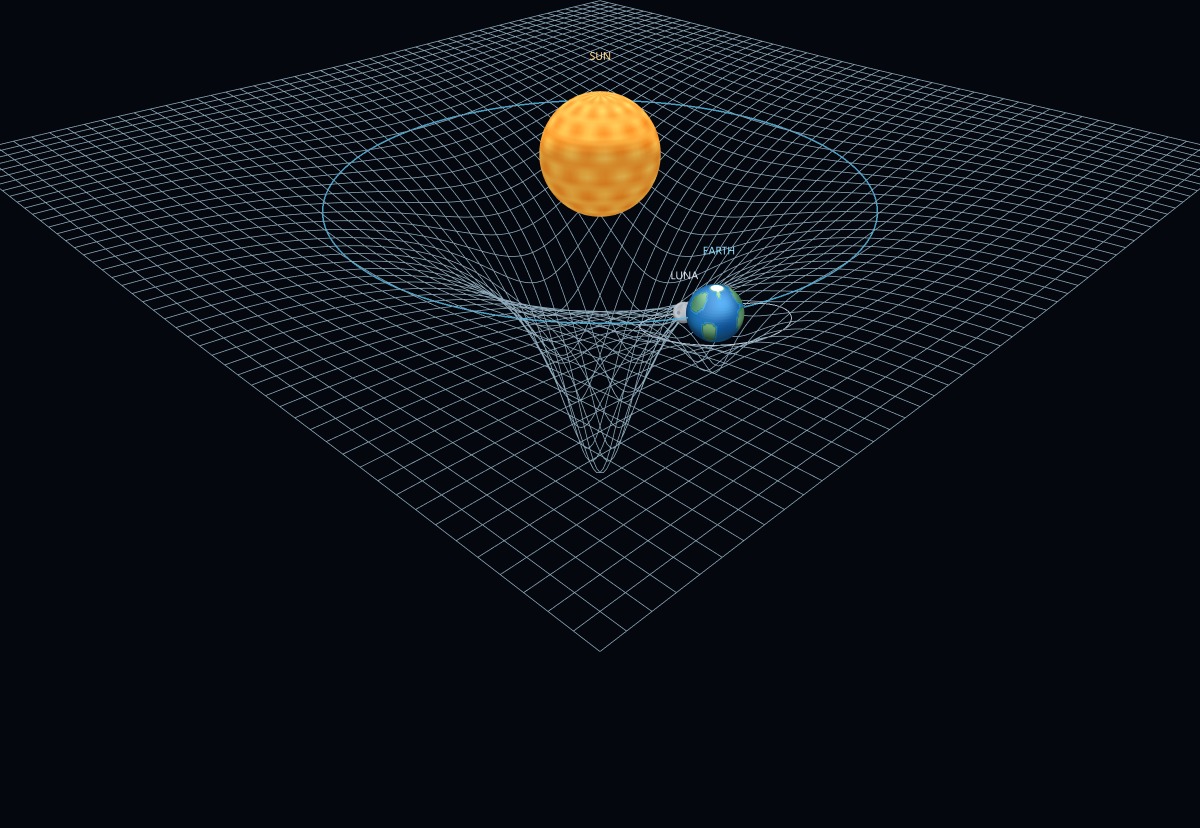
Preview of the Gravity visualization

02 / Physics

The shape of gravity.

Explore a moving model of the Sun, Earth, and Moon, and the geometry of a gravitational well. Change the view and investigate the motion.

Explore Gravity
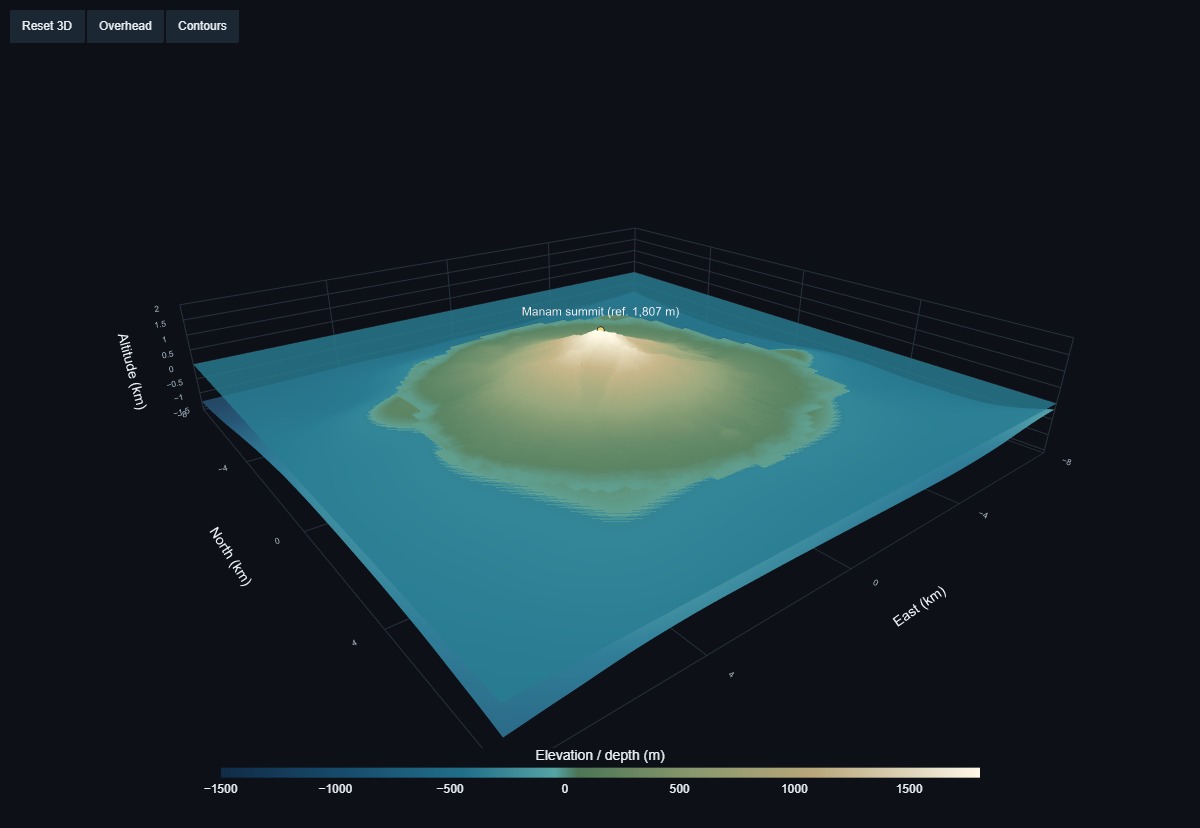
Three-dimensional elevation model of Manam volcano rising from the surrounding sea floor

03 / Topography

A volcano above and below sea level.

Explore Manam through real elevation and bathymetry. Turn the volcanic island in three dimensions, follow its contours, and see the sea floor surrounding it.

Explore Manam 3D
Preview of the Bundestag Sankey visualization

04 / Society

A changing electorate.

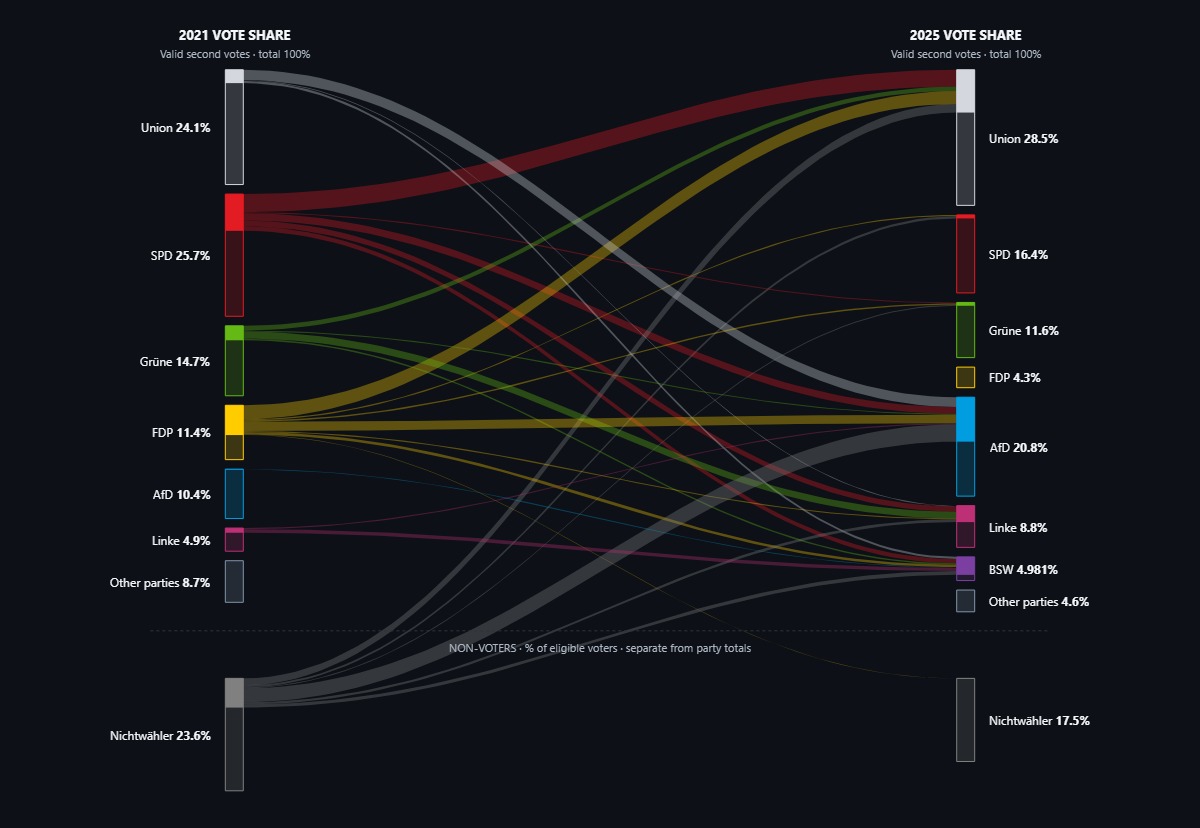
How did Germany's electorate change between the 2021 and 2025 federal elections? Follow estimated voter movements between parties and uncover the shifts behind the election results.

Explore Bundestag Sankey
Preview of the Tesseract visualization

05 / Geometry

Beyond three dimensions.

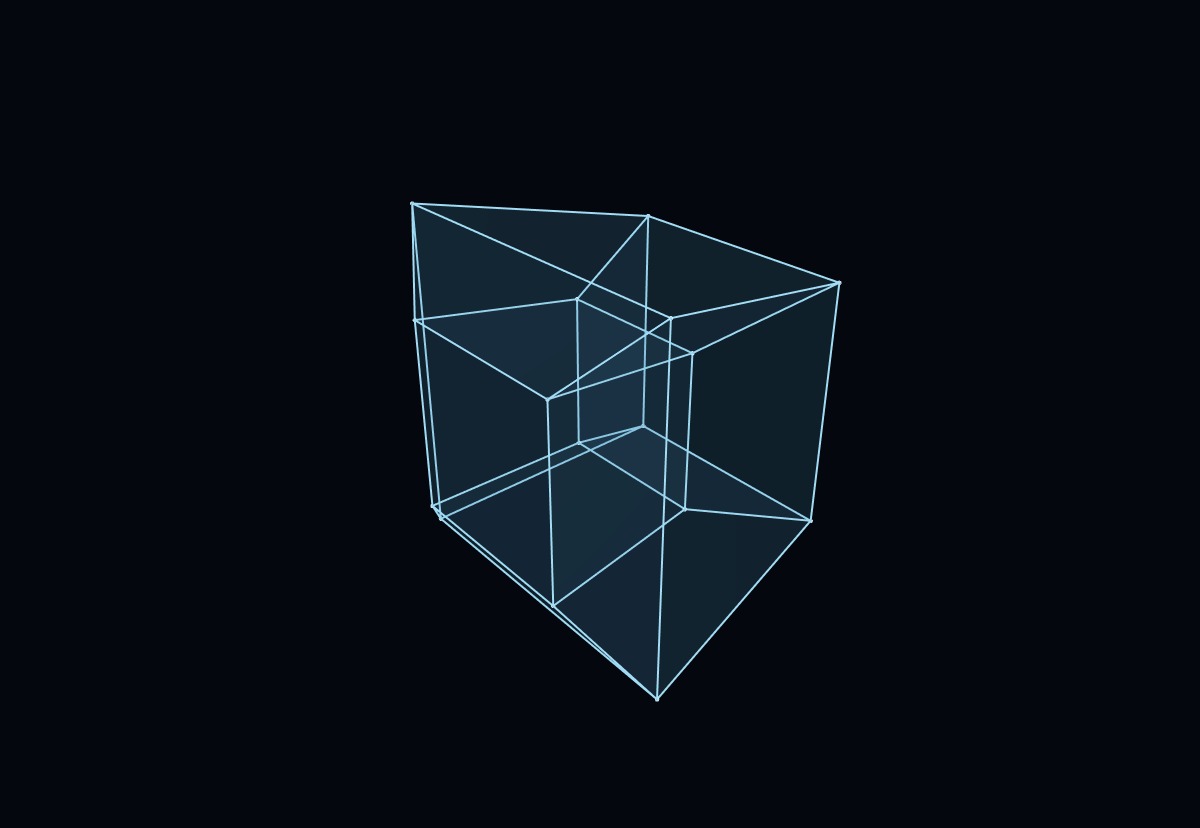
Meet the tesseract: a four-dimensional cube seen through a three-dimensional projection. Rotate it to discover how its edges connect.

Explore Tesseract
Preview of the German Rivers visualization

06 / Geography

Where rivers meet.

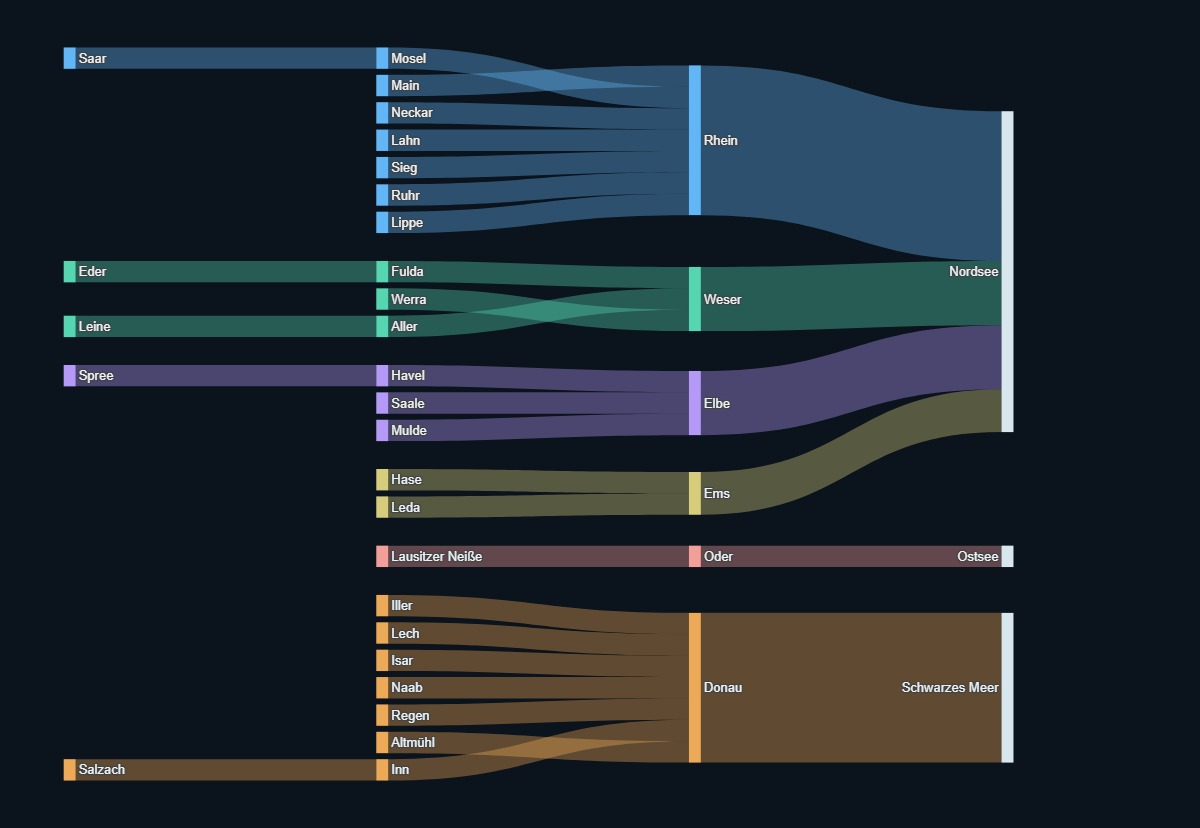
Follow Germany’s rivers through a network of tributaries, confluences, and drainage basins. A different way to see how a landscape connects.

Explore German Rivers
Preview of the Interactive Line Plot visualization

07 / Data exploration

Start with a line.

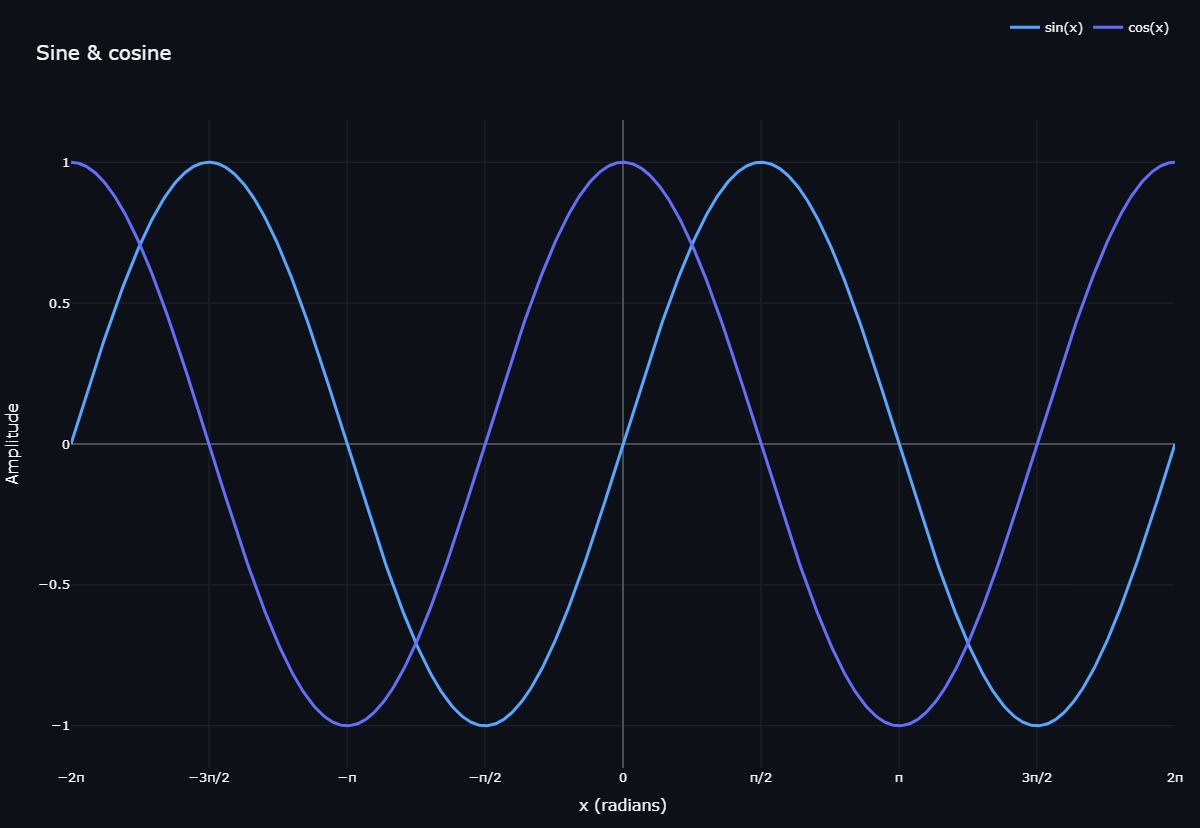
An interactive line plot and a simple invitation to explore: zoom in, inspect individual points, and find the patterns in the data.

Explore Interactive Line Plot

There’s more beneath the surface.

Explore the notebooks, follow the methods, and see how each visualization takes shape.

Explore the source on GitHub

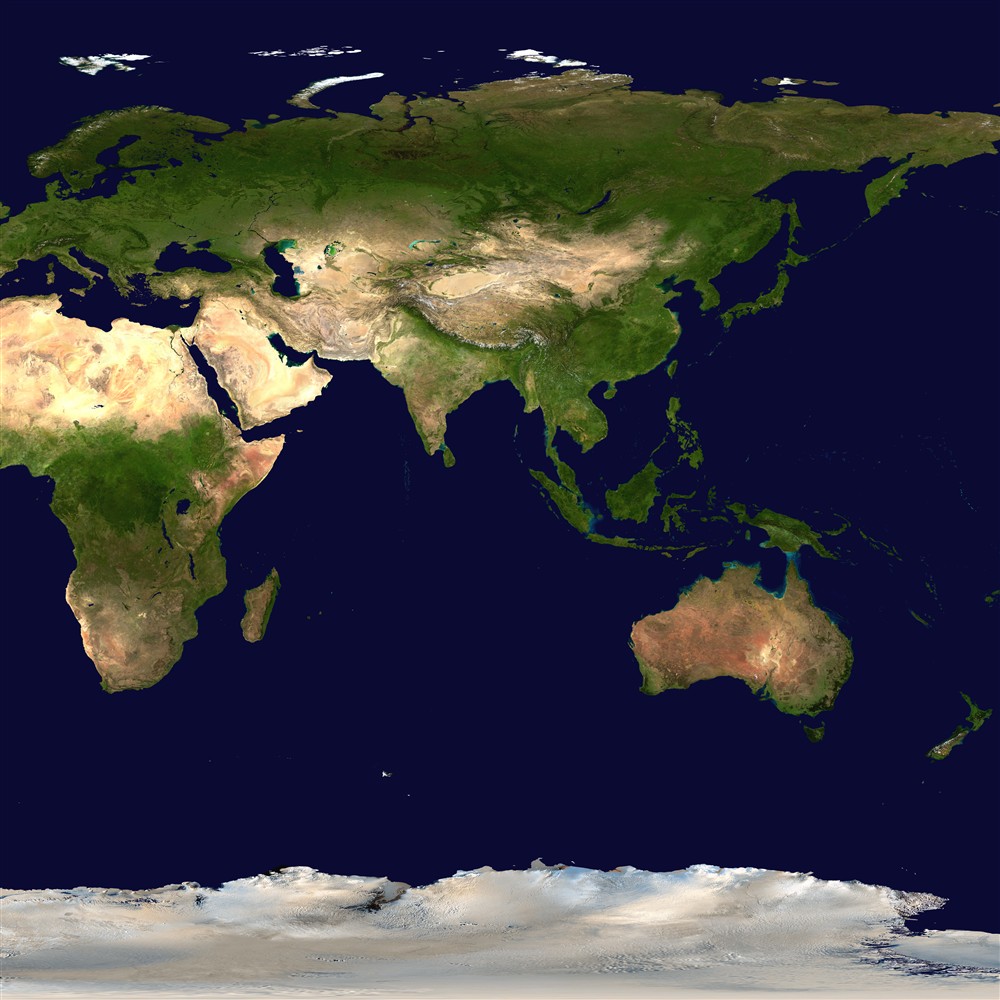
Earth imagery: NASA/Goddard Space Flight Center Scientific Visualization Studio. Blue Marble data courtesy of Reto Stöckli (NASA/GSFC).